
Visitor analytics for airports
From kerb to gate, optimise every step of the passenger journey to cut congestion, improve experience and grow retail and advertising revenue.
Measured across terminals, gates and security lanes, privacy-first.
Trusted by









Why airports choose Bumbee Labs
-
Kerb to gate
Track passenger flow across check-in, security, retail, dining and boarding in one view.
-
Method fusion
Wi-Fi, 5G and 3D sensors (with partners such as Xovis) combine for precision where it matters.
-
Privacy-first
Anonymous, aggregated measurement with a data protection authority's approval.
How it works
-
Measure
Using the Wi-Fi already deployed across the terminal (not all access points are needed), fused with 3D sensors at high-throughput entrances such as check-in and security where precise in/out counts matter.
-
Process
Bumbee Labs' statistical engine filters and processes the anonymous data, calibrating it against manual control counts.
-
Deliver
Stakeholder-specific dashboards on the Explore portal, or straight into your own BI through a well-documented API.
What data you get
Airports are measured as zones (check-in, security, gates, waiting areas, duty-free, food court, lounges, corridors and advertising spots), each tracked on its own and in relation to the others:
- Visits and dwell time, total and per zone
- Queue lengths, actual and predicted waiting times, and throughput (PAX per hour) at security, check-in and boarding
- Real-time crowding at minute-level granularity, with replay and crowd alerts, to manage bottlenecks as they happen
- Paths, flows and zone correlation, where travellers come from, where they go next, cross-shopping
- The conversion funnel: passers-by → enter → stay → buy, to lift spend in retail and F&B
- Advertising exposure, reach, impressions and dwell at screens and event spaces
- Periodic reporting (hourly, daily, weekly, monthly) for staffing, cleaning, maintenance and stakeholder reports
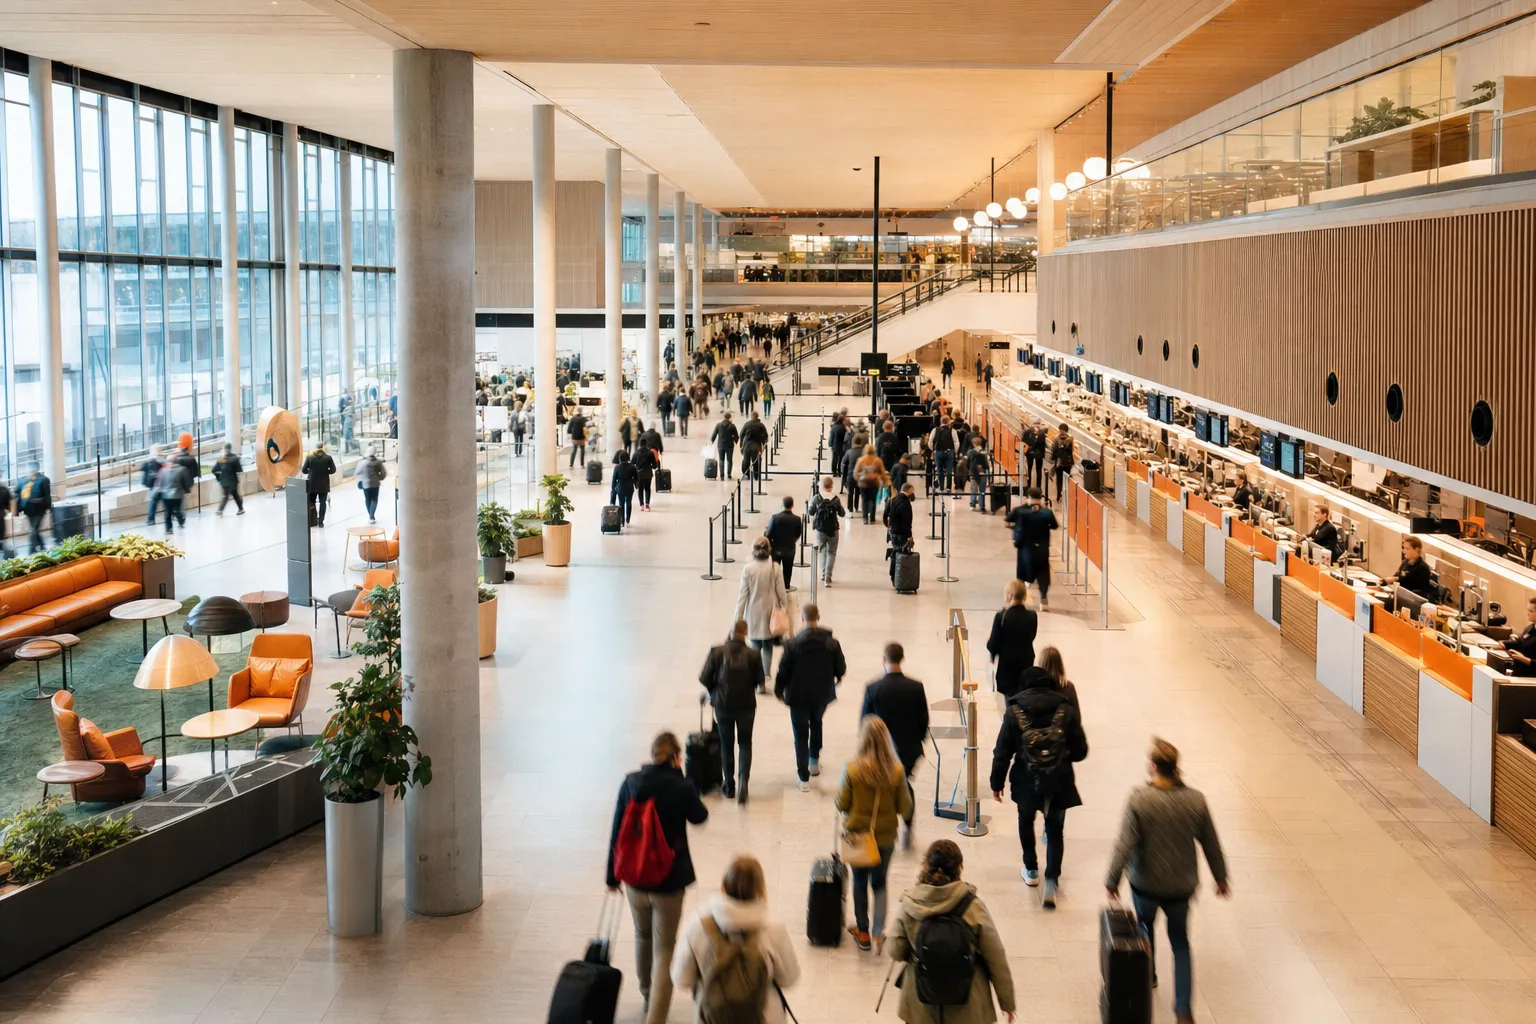
Passenger flow analytics, kerb to gate
From check-in and security to retail, dining and boarding, every step in the passenger journey is a chance to improve efficiency and grow revenue. An airport is a complex operation with extraordinary volumes and many stakeholders (property and management, airlines and ground transport, retailers and F&B, media operators, security and authorities), each needing different intelligence. Privacy-first passenger flow analytics give all of them one trustworthy picture of how travellers move, where they linger and where flow breaks down. And because this is the only footfall method in Europe approved by a data protection authority, that picture is safe to act on in critical public infrastructure.
What airports use it for
- Optimise passenger flow from kerb to gate, and reduce congestion at check-in, security and boarding.
- Lift retail and F&B sales in duty-free and terminal areas by managing the conversion funnel.
- Prove advertising and sponsorship value with real exposure data.
- Support security, infrastructure planning and preventive maintenance with real-time passenger counting data and historical movement trends.
Queue management at security and check-in
Queues are where an airport’s reputation is decided, and where measurement pays back fastest. Zone-level counting turns the security line into live numbers: queue length now, actual and predicted waiting time, and throughput in passengers per hour, updated at minute-level granularity with replay for after-action review. Operations teams redeploy staff before a breach instead of after a complaint, planners see how the morning peak actually behaves week by week, and the same data proves service levels to airlines and authorities. Where exact line-crossing counts matter most, 3D sensors carry the precision while Wi-Fi reads the flows around them.
Start with a pilot, scale on evidence
Airports buy with many stakeholders at the table, and nothing convinces a committee like its own terminal’s data. That is why the normal path is a scoped pilot: pick a slice of the operation (a security lane, an arrivals corridor, a retail zone), install and calibrate, agree the KPIs up front, and run to a structured evaluation with a clear decision point for wider rollout. The pilot delivers real dashboards on real passengers, so the business case for scaling is written by your own operation. Tell us which part of the terminal hurts most and we will come back with a pilot scope.
Proof from a high-volume hub
The same zone-analytics approach is proven at a major Stockholm transport hub with very high daily volumes and a large mix of shops and restaurants, where it re-planned staffing, lifted retail and F&B spend, reduced bottlenecks and valued advertising spots. Read the transport hub case →
Curious what this looks like for your venue?

Compliant where it counts
Passenger flow without personal data: anonymous, aggregated and approved by a data protection authority.
Telia's partnership with Bumbee Labs is important for us to expand our business. It allows us to develop our use cases for location and movement insights to be even more granular. By combining our anonymized and aggregated mobile network data with Bumbee Labs solution of GDPR-safe Wi-Fi probe data, we ensure that the collection of data follows the strictest guidelines of GDPR compliance all the way.
Frequently asked questions
Can you measure specific touchpoints like security or check-in?
Yes. Check-in, security, gates, retail and F&B can each be zoned separately, so you can see where congestion builds and where dwell time turns into spend.
How do you achieve precision at very busy entrances?
For high-throughput entrances we can fuse Wi-Fi with 3D sensors (with partners such as Xovis) for high-precision in/out counts, while Wi-Fi handles flows, dwell and zone correlation across the wider terminal.
Can the system predict waiting times, or only measure them?
Both. Live queue lengths and waiting times run alongside predicted waiting times, so operations can act before a queue breaches its target instead of after, and alerts can trigger on either.
Can we start with one terminal, or even a single checkpoint?
Yes, and that is the normal path: a scoped pilot covering, say, one security lane and one retail zone, with agreed KPIs, installation and calibration, and a structured evaluation at the end. The decision to scale is then made on your own numbers, not on a promise.
Is this compliant for critical public infrastructure?
Yes. Measurement is anonymous and aggregated, with a data protection authority's approval, which is exactly the bar critical infrastructure has to set.