
Traffic counting
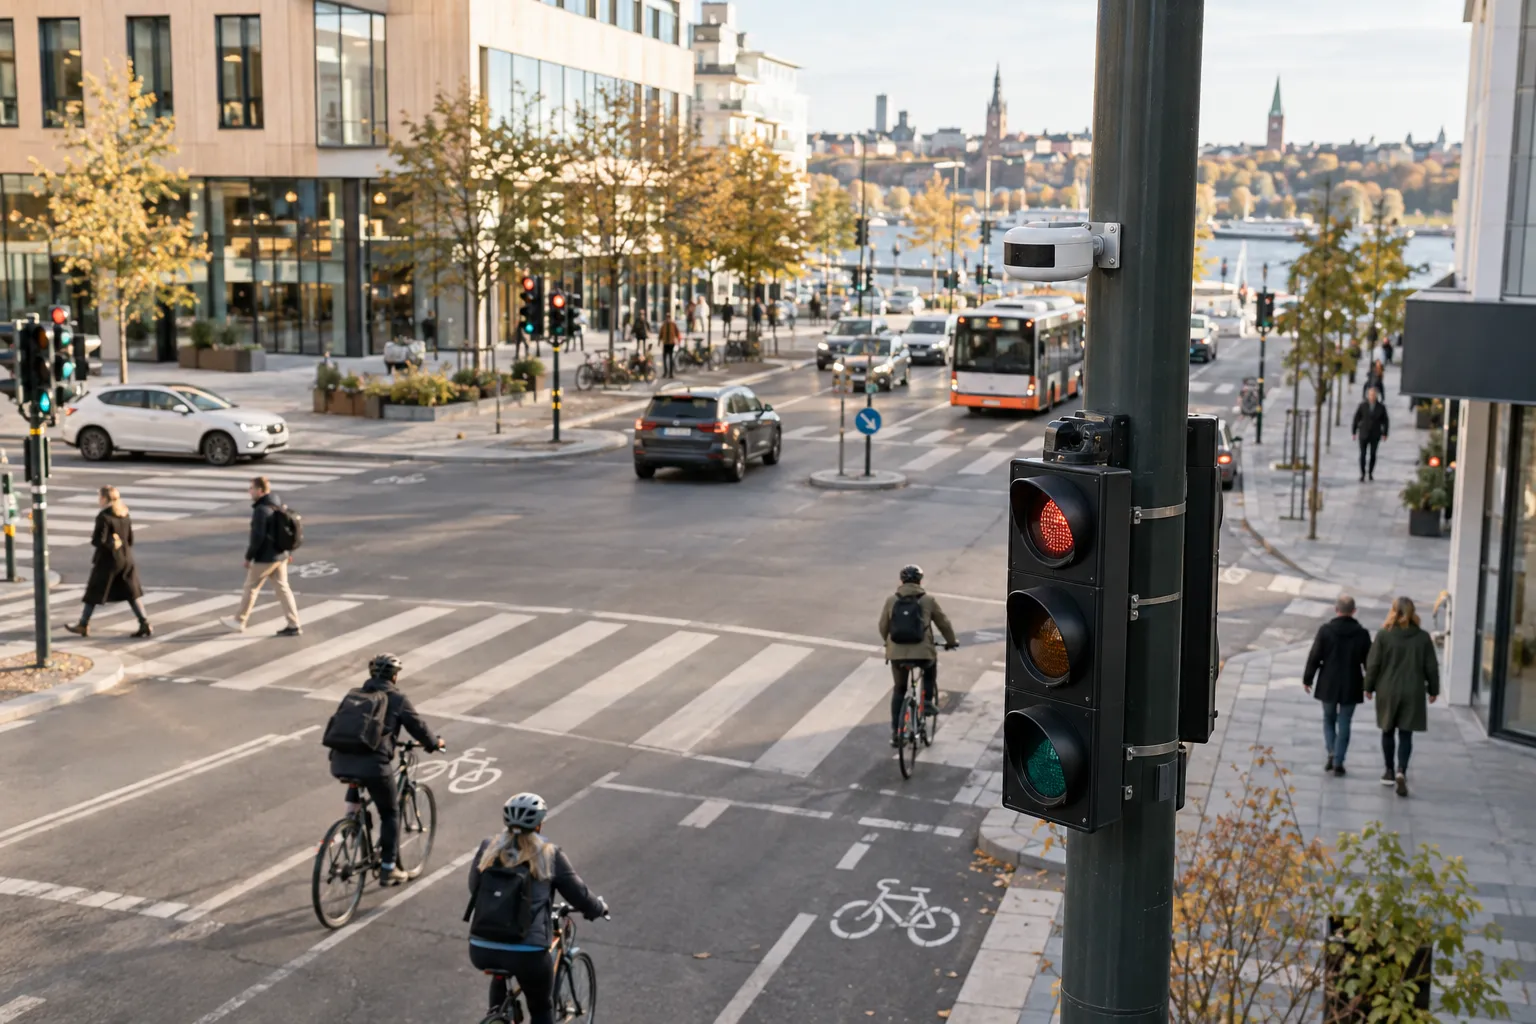
Vehicle counts by direction and hour for streets, site entrances and access roads, from LiDAR or AI cameras, in the same platform as your people flows.
On this page
Traffic counting from Bumbee Labs, also called a traffic survey, gives you vehicle counts by direction, hour and day on streets, site entrances and access roads, as a continuous series. LiDAR sensors or AI cameras do the counting. Bumbee Labs is the company behind the only footfall method in Europe approved by a data protection authority.
The short version
- Continuous vehicle counts by direction, hour, day and season for streets, site entrances and access roads.
- LiDAR or AI cameras do the counting, and neither needs number plates.
- Counts reach you through a dashboard, an API or exported files, in the same platform as your footfall data.
- The six planning questions below run from old counts to a school street, followed by a list of further questions.
What do traffic planners ask a traffic survey to answer?
Is a two-week count from 2019 still the truth about our street?
A sample describes the week it was taken. For a street, site entrance or access road, a continuous series from LiDAR or an AI camera gives vehicle counts by direction, hour, day and season, so you read trends and peaks from the data itself. Planning figures such as AADT then rest on a series that is still running.
Where do we find counts to calibrate the traffic model against?
A traffic model is calibrated against counts by direction and hour, so the consultant needs the series in a form the model can read. Bumbee Labs delivers LiDAR and AI camera counts through the People counting API or as exported files. Consultancies that want to work with us can read about the partner programme.
Did the traffic just move to the next street?
To tell, count the changed street and its neighbours over the same period. An AI camera or LiDAR sensor on each section gives vehicle counts by direction and hour, so you can set the before and after of a closure, a low-traffic area or a new one-way street side by side.
Residents say too many cars use our street. What do we tell them?
Start with the count. A traffic count by direction, hour and day shows how much traffic the street carries and when, which gives the municipality figures to answer a complaint or a citizen proposal. Counts taken the same way on other streets can then be set beside it; see benchmarking footfall for how comparison works.
How much traffic will the new housing area generate?
Until someone counts, the traffic forecast for a new housing area stays an estimate. Measure the connecting streets before construction starts and again after residents move in, and the difference shows the traffic the area generates. The series arrives as vehicle count data by direction and hour, measured the same way in both periods.
Did the school street cut car traffic and raise walking and cycling?
Count the school street and the streets around it before and after the change. A LiDAR sensor separates vehicles, cyclists and pedestrians on the same installation, so car traffic, cycling and walking on the school street appear side by side in one measurement.
Which other traffic questions do we measure?
- What share of the traffic is heavy? The measurement separates vehicles, cyclists and pedestrians as standard, and finer vehicle classification is configured per project against your requirement.
- How much traffic goes each way, hour by hour? Counts by direction, hour, day and season show the commuter tide and the weekend pattern.
- What did the roadworks and the diversion do? Before and after comparisons show the traffic during a diversion and after it.
- Do cars drive too fast past the school? A count by direction and hour shows how many pass and when. Speed is measured as well.
- How many people walk along the street, and how many drive? Pedestrians are a movement class on the same installation, and vehicle counting is as anonymous as our public-space pedestrian counting for cities and municipalities.
- The consultant needs count data for the traffic study. The series comes by direction and hour through the API or as exported files.
- The national traffic count does not cover our streets. Official figures cover the national network, so a municipality gets its own for local streets by procuring a count of them.
- The noise mapping needs current traffic volumes per street. A continuous series gives current volumes per measured street, and AADT, the basis for noise and safety calculations, comes straight from it.
- Where does the traffic come from? Mobile network data shows which districts people travel from, per day and season.
- How are the approach roads loaded when the arena has a match? Counts by direction and hour show the arrivals around an event; read them against parking occupancy and visitor numbers.
Whether citizens are being filmed, and whether cameras in the street are politically acceptable, are two questions we answer on our traffic measurement data protection page.
Do traffic survey cameras or LiDAR do the counting?
Either does. Vehicle counting with LiDAR measures moving geometry with no imagery at all, and an AI camera in counting mode outputs counts and keeps no footage. Neither reads number plates for the count. The Automatic traffic count page compares tubes, radar, cameras and LiDAR. Vehicle arrivals can also be read against footfall at a site such as a petrol station.
Curious what this looks like for your venue?
Why count traffic with Bumbee Labs
-
Continuous counts
Around-the-clock counts by direction and hour replace occasional tube counts and manual samples, so trends and peaks are measured rather than estimated.
-
Built to be anonymous
LiDAR-based counting measures moving geometry with no imagery at all, and AI camera counting outputs numbers instead of footage. No number plates or identities are needed to count.
-
Vehicles and people in one picture
Vehicle counts sit in the same dashboards and API as pedestrian, bicycle and footfall data, so you can read all arrivals at a site together.
Frequently asked questions
How is continuous traffic counting different from a traditional traffic survey on a street?
Traditional road counts are often short samples: a tube across the road for a week, or a manual count at a junction. This measurement runs continuously, delivers by direction and hour, and lands in the same platform as your other movement data, so it serves ongoing operations as well as one-off studies.
Does traffic counting for a municipality read number plates?
No plates are read for the count. Counting needs no identity: LiDAR sees moving geometry and AI cameras output counts rather than footage. That keeps the measurement anonymous and easy to approve. For use cases that do require plate recognition, talk to us about the setup that fits.
Can traffic counting measure directional split and traffic rhythm on a street?
Yes, that is the main deliverable: counts by direction, hour, day and season, so the commuter tide, the weekend pattern and the before/after of any change come straight off the series instead of being estimated.
Can traffic counting on a street separate vehicle types, like heavy traffic?
The measurement separates movement classes (vehicles, cyclists and pedestrians) as standard. Finer vehicle classification is configured per project against your requirement, so tell us what your planning question needs and we will scope the setup to answer it.
Where does traffic counting make sense for a retail site or petrol station?
Wherever arrivals start at the kerb: forecourts and petrol stations, retail sites with car-borne customers, venues judging parking pressure against visitor numbers. Reading vehicle arrivals against in-store footfall shows how well the site converts traffic into visits.
Where this fits
Part of
Challenges
Platform and integrations
News
Data protection:GDPR-compliant footfall analyticsThe IMY decisionGDPR & traffic measurementEU AI Act