
Visitor analytics for amusement parks
See how guests move between attractions, food and retail in parks and at ski resorts, and where they gather and wait.
Wi-Fi + sensors across entrances, attractions, food and retail, privacy-first.
Trusted by









Why parks choose Bumbee Labs
-
Flows between zones
Follow how guests move between entrances, attractions, food and retail across the day.
-
Queues & dwell
Spot where guests wait and where they linger, so you can balance staffing and ease congestion.
-
Privacy-first
Guests are counted as anonymous flows and never identified.
How it works
-
Measure
Wi-Fi across the park is zoned to entrances, attractions, food and retail and can cover wide outdoor areas. Sensors are added where precise entrance counts matter.
-
Process
Bumbee Labs' statistical engine filters and processes the anonymous signals and calibrates them against manual control counts.
-
Deliver
Dashboards on the Explore portal, or into your own BI via a well-documented API.
What data you get
Guests are counted as anonymous flows across the park, with each area tracked on its own and in relation to the others.
- Visits and dwell time, total and per zone (entrances, attractions, food, retail)
- Crowding in near real time with the Crowd Alert add-on, for crowd management around peaks and breaks
- Paths, flows and zone correlation where guests go between attractions, amenities and shops
- Peaks and trends by hour, day and season
- Repeat/return patterns (with visitor opt-in) and the relationship between areas (e.g. which attractions feed which food and retail)
- Advertising and event exposure for in-park placements
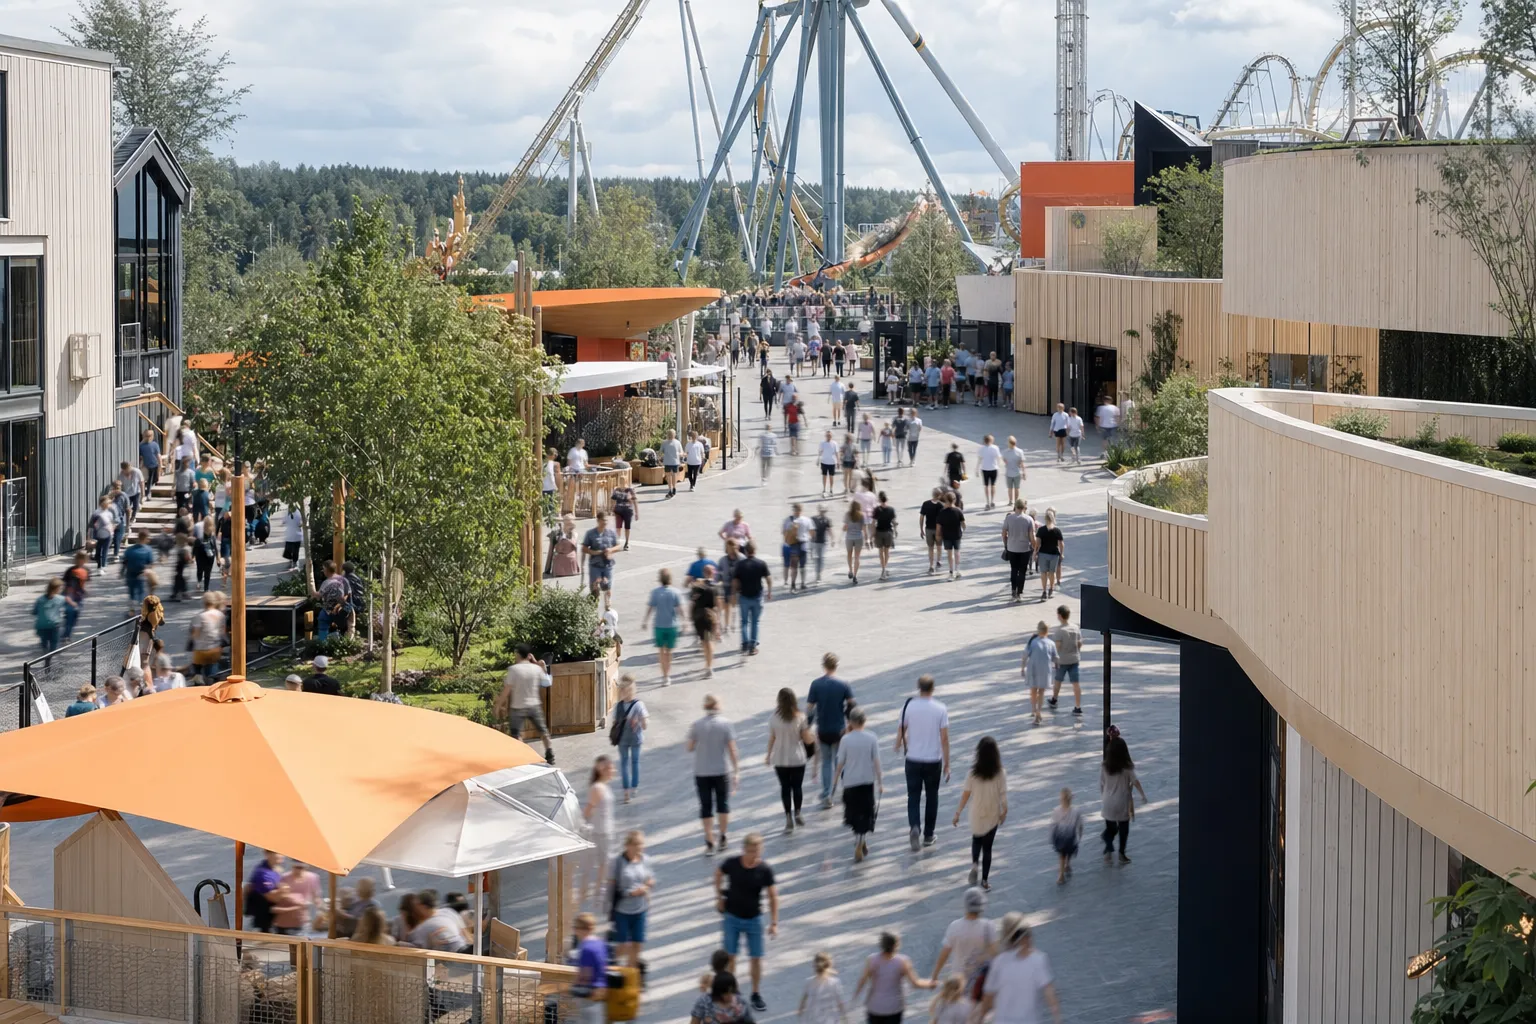
Amusement park visitor analytics from Bumbee Labs, also called theme park analytics, measures queues, guest flows, dwell time and occupancy across the park with Wi-Fi and sensors. Ski resorts can use the same measurement on their lifts. Bumbee Labs is the company behind the only footfall method in Europe approved by a data protection authority.
The short version
- Queues, guest flows, dwell time and occupancy are measured per zone across a park, with Wi-Fi zones and sensors where exact counts matter.
- Ski resorts use the same measurement on their lifts; at SkiStar in Åre, guests see a green, yellow or red queue status.
- The six questions below run from queues and queue status to staffing and where visitors come from, followed by a list of ten more.
How does theme park analytics help manage queues and guest flow?
Queues build all over the park. Where do guests wait, and where do they linger?
Wi-Fi zones follow the park’s attractions, entrances, food and retail, so each ride and each food area is measured on its own. Dwell time per zone shows where guests wait and where they linger, and 3D sensors add exact counts where an entrance needs them. Staffing and amenities can then follow the real peaks.
Can our guests see the lift queue before they walk to the lift?
At the ski resort in Åre, the SkiStar 360 app and screens at selected lifts show queue status in real time: green is no queue, yellow a little, red a queue. Free for guests, it is built on AI and anonymised Wi-Fi people counting from Bumbee Labs. Read Two years of AI-based queue status on the lifts at SkiStar.
Guests want the queue time in our app. What does the park have to measure?
Start with a zone on each park attraction, so every ride has its own count. The counts arrive in a dashboard on the Explore portal, or in your own BI through the People counting API. At SkiStar, a queue status in the app gives guests a colour-coded picture at the lifts, which they use to plan their day.
Everyone queues at the same lifts. How do we spread the skiers across the ski area?
Flows between zones show which lifts and areas fill up and where skiers head next, and flow heatmaps show the same pattern across the resort. At SkiStar, the lift queue status has two purposes: to make it easier for guests to plan the day and to even out guest flows across the ski area.
Who is in the park or resort, and when do we staff for it?
How many staff do the rides and kiosks need at each hour of a busy day?
Counts per zone by hour, day and season show when each ride and kiosk is busy, so a theme park can match staffing and amenities to the real peaks. A roster starts from that hourly curve, and staff planning with footfall data shows how one is built from the footfall / visitor count.
Arenas have similar short surges. At Hovet Arena in Stockholm, Bumbee Labs analyses the surges at breaks to place staff and security; see arena and event crowd flows.
How many people are in the resort during the week, and where do they come from?
Mobile network data measures footfall and catchment across a whole area, so a ski resort can see how many visitors are around and where they travel from. It uses anonymised, aggregated 4G and 5G network data, needs no app on anyone’s phone and covers wide outdoor areas where Wi-Fi or sensors everywhere would be impractical.
Which other park questions can we measure?
- Where do visitors gather across a large outdoor site? Wi-Fi covers wide outdoor areas, with sensors added where exact counts matter, as in hybrid people counting. Flows and dwell time show which areas draw people and which stay empty.
- How many guests actually came? Visits and dwell time are counted in total and per zone, so the figure for the day and for each area comes from the same measurement.
- How many guests may be here at once, and can we show we stayed under? Exact entrance counts and occupancy per zone show how many guests are on site against the limit you set. Whether that meets your licence is for you and the authority to decide.
- Can we get an alert before a zone gets crowded? The Crowd Alert add-on sends an alert in near real time when a zone passes a threshold you set; see data deliverables.
- Did the event raise footfall in the town, or only on the evening itself? Comparing before, during and after against a baseline is the method in measure event impact.
- Where did our visitors come from? Catchment analysis shows where visitors originate, district by district; see where visitors come from.
- What is the sponsor space worth? Advertising and event exposure for in-park placements is read per zone as visits and dwell time on the day; see Outdoor & DOOH advertising.
- Where do the guards, kiosks and cleaners need to be after a show? Flow and dwell data show where the crowd goes next, so crews can be in place when it gets there.
- The weather decides our day. Daily counts give the baseline that tells weather apart from other causes; see weather and footfall.
- When should the gates open, and how many entrances do we need? Exact counts from sensors at the entrances and peaks by hour show when guests arrive; tell us how many gates you run and we will scope the setup.
Curious what this looks like for your venue?

Approved and validated
Measurement is anonymous and aggregated: you follow how crowds move through the park, and individual guests are never tracked. Bumbee Labs is the company behind a footfall method approved by a data protection authority.
It is just fantastic that this AI-based analysis can produce live queue status. For the guest, this is simply perfect. It contributes to a great experience, and what we aim for in developing the 360 app is to make it easier for our guests. Using AI makes an incredible difference.
Frequently asked questions
Can amusement park visitor analytics measure specific attractions or areas?
Yes. Zones can map to entrances, individual attractions and the retail and food areas, so you see how each part of the park performs and how guests move between them.
Can theme park analytics handle short, intense peaks in a park, like a show break?
Yes. Crowd alerts in near real time with the Crowd Alert add-on, plus flow and dwell data, show where guests surge and which amenities they head for, so you can pre-position staff and ease congestion.
Does amusement park analytics work outdoors across a large park?
Yes. Wi-Fi covers wide outdoor areas; where precise entrance counts matter, it can be combined with sensors.
Where this fits
Industries and segments
Metrics
Methods
Platform and integrations
Data protection:GDPR-compliant footfall analyticsThe IMY decisionEU AI Act