
Airport queue and dwell time measurement
Airport queue time is measured per security lane from the Wi-Fi the terminal already runs, with LiDAR or 3D sensors added where a lane needs point precision. Anonymous figures for queue length and waiting time by hour, day and season show operations when each lane builds up and clears.
Wi-Fi and LiDAR, anonymised at source. No personal images are stored.
Trusted by









What makes it work
-
Queue, gate and dwell times
Security queue wait time, gate flows and dwell per zone are available live and as trends, so operations and retail plan on the same numbers.
-
Measured without storing images
Wi-Fi on the terminal's existing network and LiDAR or 3D sensors where point precision matters, anonymised at source. Bumbee Labs is the company behind a footfall method approved by a data protection authority.
-
Operations and revenue on one source
Flow data supports capacity and staffing, and dwell data supports concession planning and rent. Both come from one measurement.
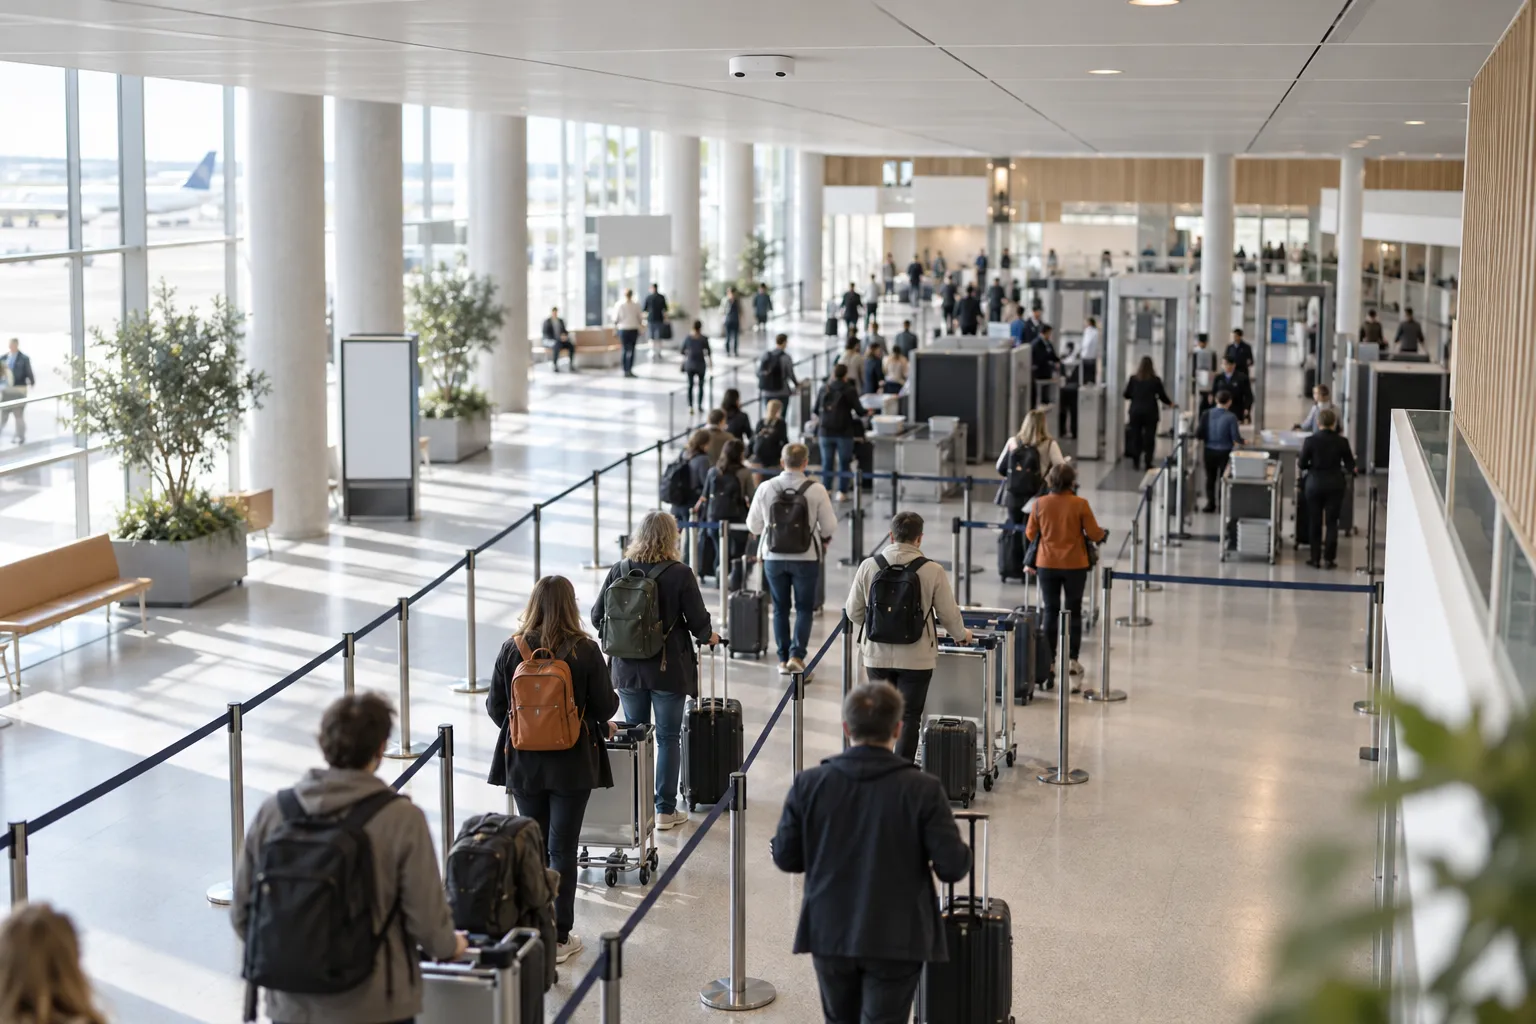
An airport queue is measured as queue length, waiting time, throughput and dwell time per zone, using Wi-Fi across the terminal and LiDAR or 3D sensors where a lane needs point precision. Flows elsewhere in the terminal are covered under airport passenger flow. Bumbee Labs is the company behind the only footfall method in Europe approved by a data protection authority.
The short version
- An airport queue is read per lane as queue length, waiting time and throughput, with dwell time per zone beside it.
- Wi-Fi in the terminal does the measuring, with LiDAR or 3D sensors where a lane needs point precision. The data is anonymous and no personal images are stored.
- Baselines by hour, day and season are included as standard, and the Crowd Alert add-on adds threshold alerts in near real time.
- Further down are six security queue questions, five shorter ones, how dwell time fits in and how to get started.
Which security decisions can airport queue measurement support?
Airport queue measurement reads flows per entrance, lane and gate, queue length and waiting time, and dwell time per zone from check-in to the gate, with occupancy and peaks across the day and the season. The same numbers feed staffing, capacity decisions and the discussion with retail.
How long is the airport security queue, and how has it looked this week?
Queue length and waiting time per lane, read by hour and day, show when each lane built up and cleared over the week. The terminal’s Wi-Fi supplies the measurement, anonymised at source, with LiDAR at the security lane or 3D sensors where point precision matters. Operations do their queue monitoring on the Explore portal.
How do we see the airport queue building before it breaks our waiting-time target?
Baselines by hour, day and season show when each lane usually builds up, so lanes can be staffed ahead of the usual peak. The Crowd Alert add-on, described under data deliverables, raises an alert in near real time when a zone such as a security queue passes a level you set.
How do we show airlines and the authorities that the security queue meets our service level?
Queue length and waiting time are reported per lane and per period and compared period on period, so the airport can show airlines and authorities its service level from one series. The figures leave the platform as scheduled or on-demand exports, or through the People counting API into your own tools.
Which lane or gate area fills fastest, and where should we move passengers?
With the parallel security lanes measured the same way, queue length and waiting time per lane show which one fills faster than the next. Gate areas read the same way, as zones with their own figures. Heatmaps of security queue flows show where passengers gather ahead of the slowest lane, so staff and lane openings can be moved there.
Why does lane 3 clear fewer passengers an hour than lane 1?
Throughput in passengers per hour, counted in and out of each lane, puts lane 3 beside lane 1 on one measure. Exact counts at a lane come from 3D sensor counting or LiDAR. The gap between the lanes shows in the numbers, and the operation works out what causes it.
Did the new security equipment, lane order or timetable shorten the airport queue?
Run the same lane measurements ahead of the change and again once it is in place, then compare queue length, waiting time and throughput side by side, hour by hour. This works the same way for new security equipment, a new lane order or a changed timetable. Wi-Fi people counting keeps the method constant before and after.
What else do airports ask about their queues?
- Check-in and bag drop: how long is the queue before security? The check-in area is measured as a zone, with waiting time and dwell time per hour, so the queue before security reads beside the security queue that follows.
- Can we measure at the checkpoint without a camera debate? Wi-Fi signals are anonymised at source and LiDAR works from laser-measured shapes. 3D sensors use video for analytics only and store no personal images. The airport’s own rules decide where the measurement sits.
- Can travellers see the waiting time? The figures reach your own systems through the API, and what travellers are shown is decided in those systems. Standard figures are ready the day after the visit.
- Passengers complain and the security queue gets the blame. A series of queue length and waiting time shows how often and when the queue builds, so the discussion starts from the measured queue.
- Is the terminal the right size for the service level we promised? Queue and occupancy measured over a longer period give the sizing discussion a measured baseline, with the peaks by hour, day and season to set against that service level.
How does dwell time per zone fit with the airport queue?
Dwell time per zone shows how long passengers stay in check-in, security, retail and at the gates, so a long wait at the checkpoint reads against the time left before boarding. Queue trends and dwell come from one source, and concession, rent and wayfinding decisions rest on measured dwell more firmly than on passenger totals alone. Dwell time explains the commercial side.
How does an airport queue measurement get started?
A terminal starts on the Wi-Fi already in the building and adds LiDAR or 3D sensors only at the points where exact counts or queue measures matter, such as a security lane. Book a demo and we will walk through what the measurement would look like for your terminal.
We are excited about the collaboration with Bumbee Labs through our Unicorn Academy program. A fantastic solution that fits in most of our industry segments such as retail, transportation, public sector etc. We are happy to support Bumbee Labs with our expertise and global presence, and we are delighted to add such an innovative solution to our portfolio, to be offered standalone or integrated in our own solutions.
Frequently asked questions
How is waiting time measured in an airport queue without storing images?
The terminal's existing Wi-Fi network supplies the measurement, with LiDAR or 3D sensors added where point precision matters. Signals are anonymised at source, so queue length and waiting time are measured without stored images or personal data and build up into trends by hour, day and season.
Is personal data kept when an airport queue is measured?
No. Personal data is irrevocably deleted at source, and what remains is anonymous, aggregated statistics. The Swedish IMY, a data protection authority, approved the footfall method behind Bumbee Labs, and no other footfall method in Europe has that standing.
Can airport queue measurement run inside the security area?
Yes. Queue length and waiting time in a security area are measured passively and anonymously, and no personal images are stored. The airport's own operating rules decide where exactly the measurement sits, and the setup follows them.

Approved and validated
You see the airport queue as anonymous, aggregated figures, with no personal data and no stored images in a sensitive environment. Bumbee Labs is the company behind the only footfall method in Europe approved by a data protection authority. The footfall method is validated by academia, partners and customers.
Where this fits
Part of
Challenges
Methods
Platform and integrations
Data protection:GDPR-compliant footfall analyticsThe IMY decisionDPIA for people counting