
Train station passenger flow analytics: run the station on measured flow
Train station passenger flow is measured zone by zone at entrances, corridors and platforms, along with how long travellers stay and when the peaks build. The measurement usually runs on the station's existing Wi-Fi network, with LiDAR where precision matters, and delivers station footfall figures without stored images or personal data.
Wi-Fi on the station's existing network and LiDAR where precision matters, with no stored images and no personal data.
Trusted by









What makes it work
-
Entrances, platforms, flows
Passenger flows per entrance, corridor and platform, so crowding, capacity and wayfinding are managed on measured numbers.
-
Measured without new hardware
Wi-Fi on the station's existing network, with LiDAR or 3D sensors where point precision matters, anonymised at source.
-
The station as a trading place
Dwell and flow around retail and services, so placements and rents can be judged on passenger minutes rather than passenger totals.
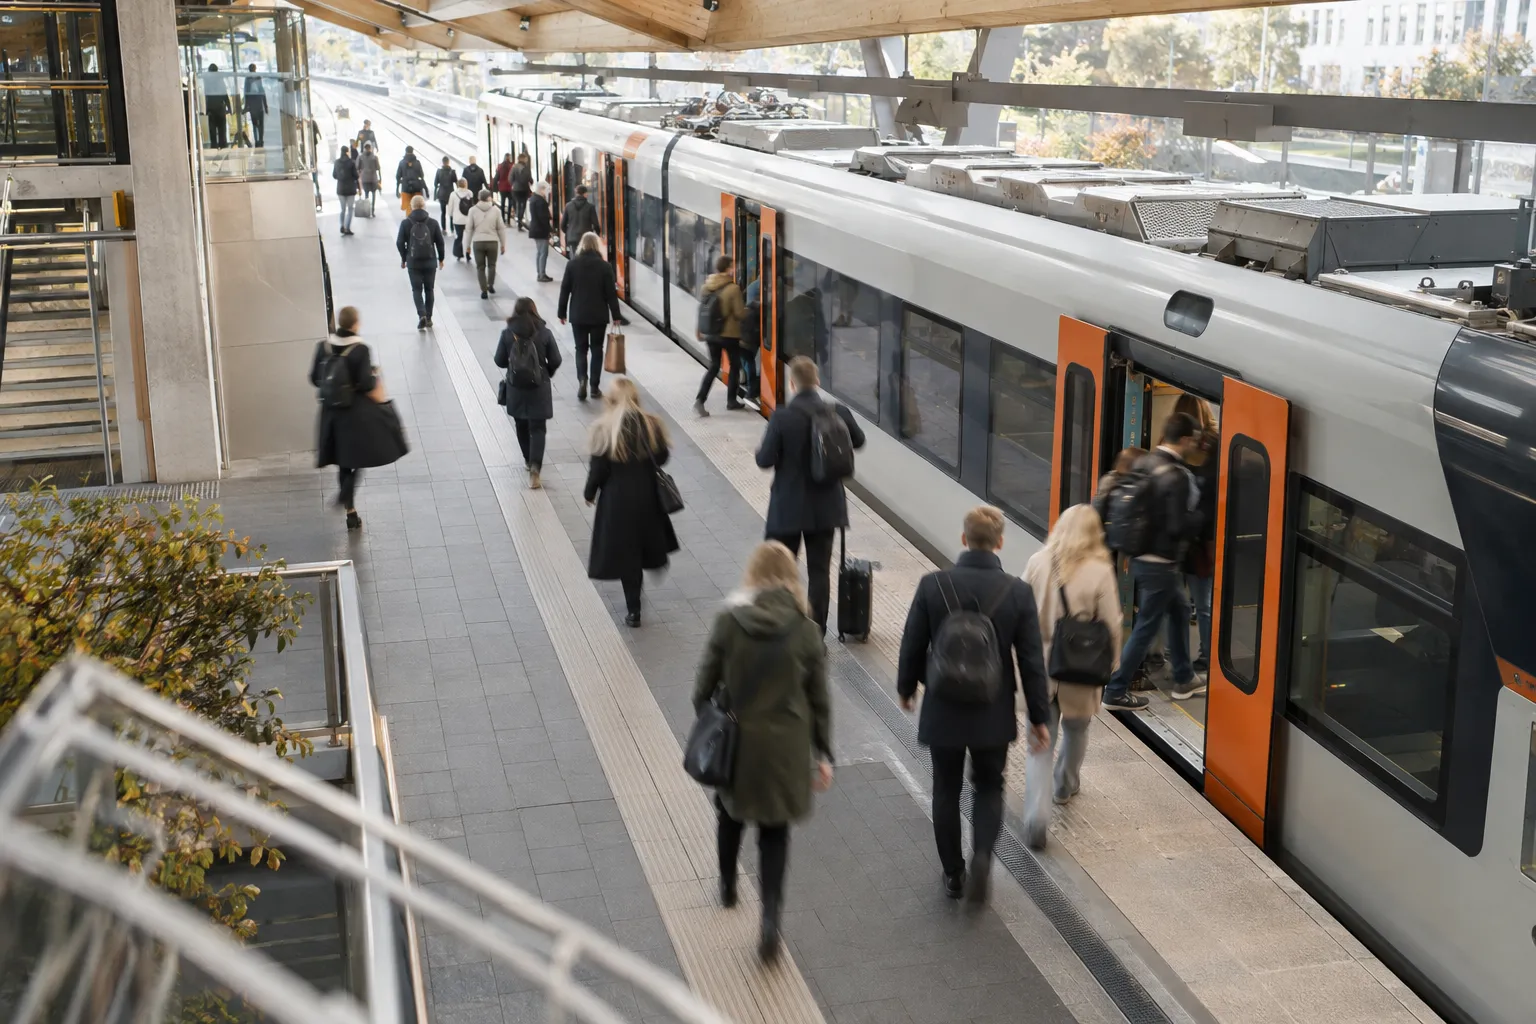
Train station passenger flow analytics measures how travellers move through a station around its timetable: which entrances and corridors carry them, where a platform fills and where they wait. Operations, retail and planning can then work from one measured series. Bumbee Labs is the company behind the only footfall method in Europe approved by a data protection authority.
The short version
- Train station passenger flow is measured zone by zone: entrances, corridors, platforms, dwell and peaks by hour and day.
- Wi-Fi usually runs on the station’s existing network, with LiDAR or 3D sensors where precision matters.
- Seven questions below cover platform load, daily station footfall figures, the crowd when a track is announced, the shops, rerouted traffic, timetable changes and interchange.
- A short list adds seven smaller questions, and a closing section names the station owner who uses the method.
Which passenger flow questions do train station operators ask?
How full does the platform get, and how does the peak build up?
Platform load is the number of travellers on a train station platform, and the peak is how that number climbs towards the busiest hours. Wi-Fi measures the load on the platforms themselves, with LiDAR or 3D sensors for exact counts where precision matters, and platform occupancy figures show which platforms fill first and when.
Can we have station footfall figures every day instead of one estimate a year?
Yes. A train station can have station footfall figures as a daily series, with standard metrics available from the day after the visit. Wi-Fi counts visits and flows across the station. The series shows peaks and lows by hour, day, week and season, and the glossary entry on footfall / visitor count defines what is counted.
What happens in the hall when the track is shown on the board?
Travellers at a train station wait in the hall and move together once the track is announced, so the crowd builds on the way to the platform. Wi-Fi measures that build-up as flow and dwell in the hall, and LiDAR or 3D sensors add exact counts where needed. Concourse heatmaps show where the crowd gathers and which way it moves.
How many minutes do travellers spend in the station between trains, and where?
A train station’s shops trade in the time travellers have between arriving and leaving. Wi-Fi measures dwell time in the hall and on the platforms, and the flow past each frontage shows where travellers wait and where they hurry by, so placement, rents and opening hours follow measured minutes.
Where do travellers go when track work and replacement buses reroute the traffic?
Track work moves a train station’s flow to other entrances and corridors for weeks at a time. Wi-Fi people counting, with LiDAR or 3D sensors where precision matters, measures each entrance and corridor the same way before, during and after the works. Comparing the three periods shows where travellers went.
What did the new timetable do to our passenger peaks?
A new timetable moves the arrival peaks at a train station, and the effect shows only if the same measurements are taken before and after it. Record flow and platform load at the same points for the weeks around the change, then compare them against the earlier baseline with benchmarking station footfall.
How do travellers move between trains, the metro and the buses inside our station?
Interchange at a train station is the path from one platform or entrance to the next. Wi-Fi measures the anonymous paths between zones across the station, and LiDAR people counting gives exact counts at the connections where precision matters. Together they measure the flow between modes inside the station.
Which smaller questions does station footfall data answer?
- How do travellers divide between our entrances and corridors? Flow per entrance and corridor shows which routes carry the load across the day and the week.
- Should the station’s shops and services open for the first and last trains? Footfall outside ordinary opening hours shows how many travellers are there, and the owner decides on hours with that evidence.
- Do daily averages hide the peaks when trains arrive in bursts? Peaks and lows by hour and day show when the load is highest, which an average over the day smooths out.
- How close does a platform get to its limit at the peak? Platform load by hour shows how full it gets, and the limit itself is the operator’s own to set.
- Do travellers find their way from the entrance to the platform? Paths and flows between entrances, corridors and platforms show which routes people take, as evidence for signage and wayfinding.
- Is the waiting room used, and when should it be open? Visits and occupancy by hour show when travellers wait inside, so opening times can follow use.
- We run several regional stations. What do we measure in each? Every station gets the same measures: flows, dwell and peaks, each with its own series by hour and day.
Which methods measure train station passenger flow?
Wi-Fi counting usually runs on the station’s existing network, and LiDAR or 3D sensors are added at the points where an exact count or a queue metric matters. Each anonymises at source, stores no personal images and creates no personal data. The data deliverables list the standard figures, and how to count visitors compares the methods.
Signals are anonymised at source, and personal data is deleted irreversibly, so only anonymous, aggregated statistics remain. The approval mentioned above comes from IMY, the Swedish Authority for Privacy Protection, and it concerns data protection.
Which station owner uses the method?
Jernhusen, the station owner, uses the method at Stockholm Central. The public transport hubs page covers the station as a whole, and airport passenger flow analytics covers the same zone approach in a terminal.
Getting started
A station can usually start on its existing Wi-Fi network, with LiDAR or 3D sensors added where precision matters. Book a demo and we will show what the measurement looks like for a station like yours.
Telia's partnership with Bumbee Labs is important for us to expand our business. It allows us to develop our use cases for location and movement insights to be even more granular. By combining our anonymized and aggregated mobile network data with Bumbee Labs solution of GDPR-safe Wi-Fi probe data, we ensure that the collection of data follows the strictest guidelines of GDPR compliance all the way.
Frequently asked questions
How is passenger flow measured in a train station?
Passenger flow is counted zone by zone. Wi-Fi on the station's existing network usually covers entrances, corridors, platforms and dwell, and LiDAR is added where precision matters. No personal images are stored, and because signals are anonymised at source, the measurement creates no personal data.
Is passenger flow measurement at a train station GDPR compliant?
Yes. The measurement is anonymous: signals are anonymised at source, personal data is deleted irreversibly and only aggregated statistics are kept, so a station can use the figures without handling personal data.
Does passenger flow measurement work for small stations too?
Yes. The same method applies from a regional stop to a central station, and it usually runs on infrastructure already in place, so a small station gets the same kind of series as a large one.

Approved and validated
The measurement is anonymous and aggregated. Bumbee Labs is the company behind the only footfall method in Europe approved by a data protection authority. Academia, partners and customers have validated the measurement.
Where this fits
Part of
Industries and segments
Metrics
Methods
Platform and integrations
Data protection:GDPR-compliant footfall analyticsThe IMY decisionDPIA for people counting