
Footfall analytics platform & API
However you count, the data lands in one place, with clear dashboards for every stakeholder and an open API that feeds the metrics into the systems you already use.
One open, documented API into the BI tools you already run.
Trusted by









What you get
-
Dashboards for everyone
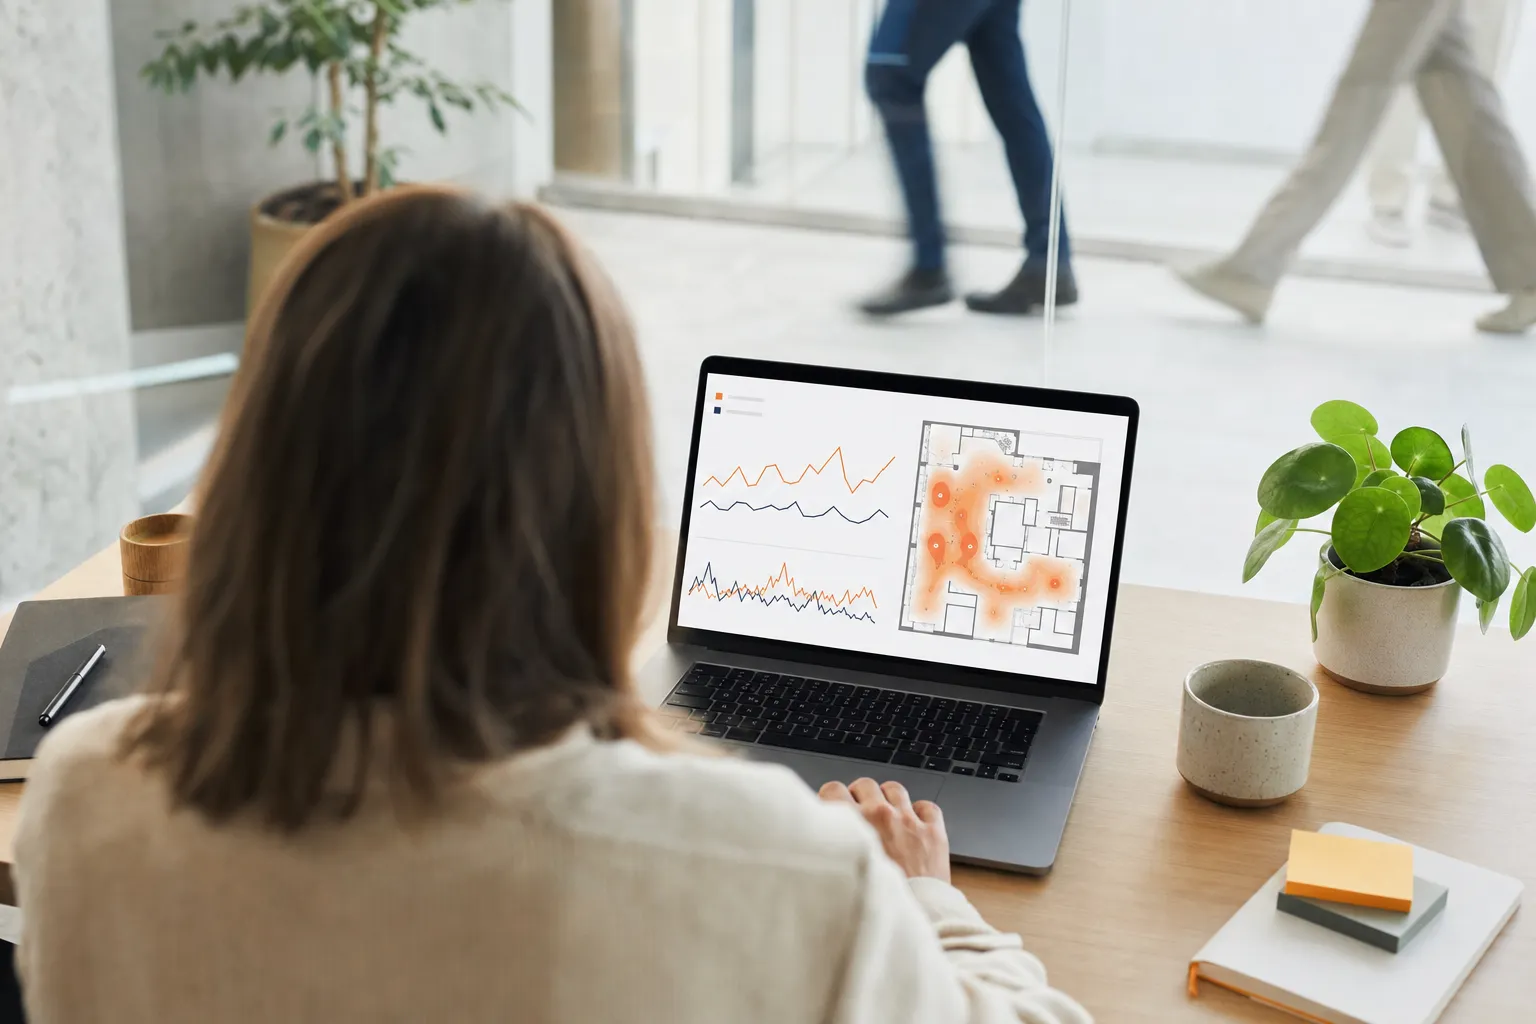
Tailored views for mall managers, city planners, store owners and transport operators, with KPIs, trends, conversion funnels and heatmaps in real time, on your own floor plan.
-
Built to integrate
Dashboard-agnostic, and able to bring in external streams (POS, weather, IoT, digital signage) so footfall is read in context.
-
Open API
A fast, well-documented, pull-based API. Plug our metrics straight into your existing BI or analytics stack, with all installations, all metrics, available 24/7.
-
One source of truth
Every method (Wi-Fi, sensors, cellular) lands in the same place, so numbers are comparable across sites, periods and campaigns.
How it works
-
Ingest
Metrics from every Bumbee Labs method (and optional external streams) arrive through one open API.
-
Model
Define zones, visitor classes and KPIs once; build dashboards per stakeholder on your floor plan or map.
-
Integrate
Connect the API to your own BI tool, or use a ready dashboard. Bring in POS, weather, IoT and signage for context.
-
Act
Track trends, run conversion funnels, benchmark sites, and trigger crowd alerts, all from one source of truth.
What data flows through the platform
The platform is where every metric lands and becomes usable. From any method you can work with:
- Visitor counts, unique visitors and in/out
- Dwell, paths, zone correlation and anchor positions
- Passers-by, capture rate and conversion funnels
- Real-time occupancy and crowd alerts
- Peaks, trends, benchmarking and external-factor correlation
The platform doesn't measure. It makes what's measured useful. See which method delivers which metric.
One platform, every method, in context
Counting is only half the story. The value is in what you do with the data. The Bumbee Labs analytics platform brings counts, paths, dwell times and trends from every method into a single place, with dashboards designed for the people who actually use them and an open API for the systems you already run.
The essence of the service is the data in the API and the intelligence you build from it. The platform is deliberately dashboard-agnostic: bring your own BI tool and we integrate into it, or use a ready dashboard with templates for common segments.
For property managers and public bodies, the platform is where visitor statistics become the currency of reporting: attendance figures for funders, footfall trends for rent reviews, and space utilisation metrics for facilities planning, all from the same source of truth.
One API, one source of truth
Footfall data is worthless trapped in a silo or locked to one rigid report. Teams need it in the tools they already use, joined to their own sales, weather and campaign data, and comparable across every site, not three different counters with three different definitions. The platform fixes that: one open API, one source of truth, and dashboards each stakeholder can actually read.
What data flows through it
Everything your installations produce: counts and unique visitors, dwell, paths, zone correlation and anchor positions, passers-by and conversion funnels, real-time occupancy and crowd alerts, plus peaks, trends, benchmarking and external-factor correlation. → See the full set and which method delivers what on the data deliverables page.
Dashboards & integration
- Custom dashboards per stakeholder (mall manager, city planner, store owner, transport operator), with KPI tracking, trends, conversion funnels and heatmaps in real time, on your own floor plan.
- Integration with external systems: POS/sales, weather, loyalty, IoT and digital signage, so footfall is read in context.
API & data access
- A fast, open, well-documented, pull-based API, available around the clock.
- All your installations and all their metrics, accessible regardless of dashboard setup.
- Flexible and scalable for enterprises, municipalities and partners. → It works with the network you already run: see supported platforms.
Curious what this looks like for your venue?

Compliant where it counts
Every metric in the platform comes from the only footfall method in Europe approved by a data protection authority. Validated by academia, partners and customers; free of personal data throughout.
We are very happy to announce this partnership with Bumbee Labs to boost our Wireless solutions portfolio and bring what we believe is the future for retail businesses, measured by trustful data. What can't be measured, can't be improved.
Frequently asked questions
How long does integration take?
Most teams start in the Explorer dashboard from day one, with nothing to build. The API is open and documented, so connecting your own BI happens at your pace and with our support; the scope depends on your stack, not on us.
How is the data delivered?
All data is delivered through the Bumbee Labs API, a fast, open, well-documented, pull-based API available 24/7. You can consume it in our dashboards, connect it to your own BI tool, schedule exports and reports, or switch on real-time crowd alerts.
Do I have to use your dashboard?
No. The platform is dashboard-agnostic, so any dashboard system can be used. If you have no preference we can suggest one and provide templates for common segments; if you do, we integrate the API into it.
Can I combine footfall with our other data?
Yes. External streams such as POS/sales, weather, loyalty, IoT and digital signage can be brought in, so footfall is read in context and you can see cause and effect, for example campaign impact or weather sensitivity.
How current is the data, and who can access it?
Standard metrics are available from the day after the visit, with same-day recurring visits and near-real-time crowd levels supported. All your installations and all their metrics are accessible through the API regardless of how any one dashboard was configured.