
Plan the city on real footfall, measured privately
Bumbee Labs gives municipalities anonymous pedestrian counts for streets, squares and districts, by hour and season, so planning, investment and follow-up of public space rest on measured use.
Whole-city flows, measured privacy-first with a method approved by a DPA.
Trusted by









Why public bodies choose Bumbee Labs
-
Privacy compliance for the public sector
Anonymous and aggregated from the start, built for the privacy constraint public bodies face.
-
Street to wider catchment
Wi-Fi at street level combined with cellular 4G/5G data shows where people come from and go, so you only need to cover the main corners and hot spots.
-
An evidence base you can share
Paths, flows, dwell and event impact you can put in front of politicians, the press and the public, and build budgets on.
On this page
Pedestrian counting for a municipality measures how many people walk each street, square and district, hour by hour. Street-level Wi-Fi counts the walkers, LiDAR adds cyclists and vehicles, and cellular (4G/5G) data shows where people come from. Bumbee Labs is the company behind the only footfall method in Europe approved by a data protection authority.
The short version
- A pedestrian counting system gives a municipality counts per street, square and district, by hour and season, as anonymous statistics about places, never about people.
- Wi-Fi counts the walkers and LiDAR counts cyclists and vehicles, and the series share one timeline.
- Cellular data adds where people come from, so only the main corners and hot spots need covering.
- Further down: six decisions the counts support, nine shorter questions and the Västerås findings.
Which decisions does pedestrian counting support in a municipality?
A municipality plans, invests in and follows up public space, and every one of those tasks needs the same figure: how many people use a place, and when. City centre questions such as the main street, vacancies and festivals are covered separately under city centre footfall.
Which district, street or junction should the investment go to?
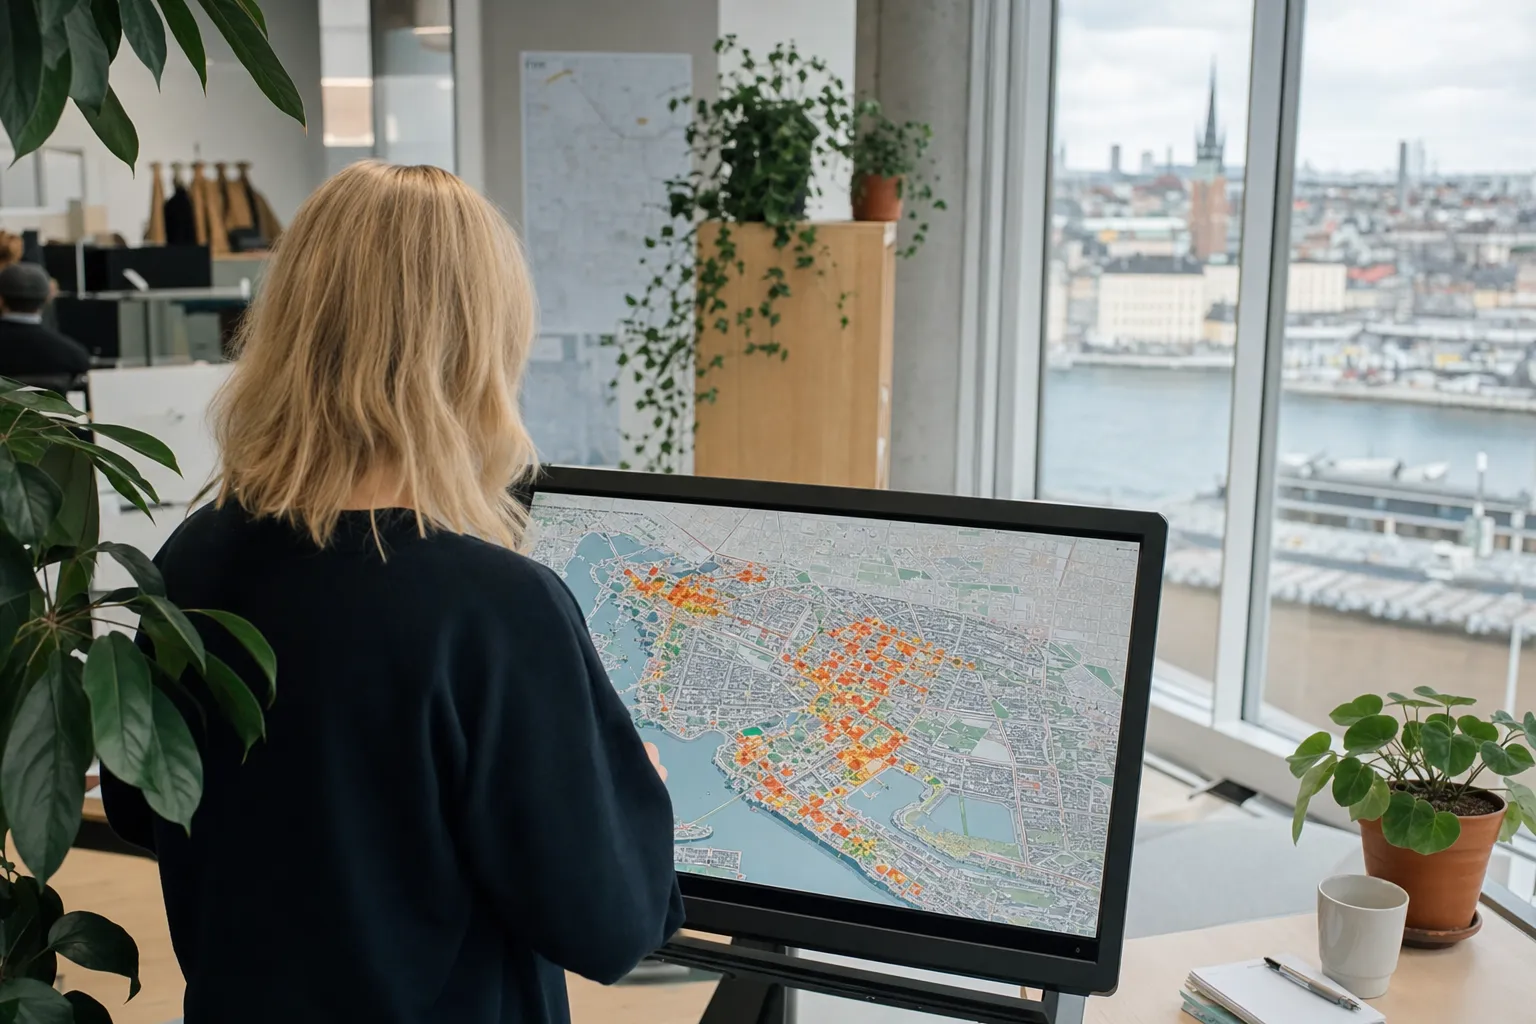
A municipality can rank its districts, streets and junctions by pedestrian footfall: how many people use each place and at which hours, and let the street budget follow use. Flow heatmaps show which routes carry the load. Every place is counted the same way, so the figures can be set side by side.
For more background, read the insight on the pulse of a neighbourhood, measured in footfall, and the one on pedestrian streets and property prices before a street is extended or shortened.
Where do people already walk, before we plan new routes, squares and housing?
Pedestrian counts show how an area is used today, before a municipality draws new routes, squares or housing into it: which routes carry people, where they cross and which squares they skirt. Desire lines show where the walked route departs from the planned one, and cellular (4G/5G) data shows where the walkers come from.
Can pedestrians, cyclists and vehicles be read in the same dataset?
Yes, with one method for each group. Wi-Fi people counting covers the pedestrians, and LiDAR counts cyclists and vehicles on streets and paths. All the series run on one platform and one timeline, so a municipality can judge a street project for walkers, cyclists and traffic together, with AADT as the traffic figure.
Bicycle counting and traffic counting describe the cyclist and vehicle side.
Did our urban renewal make a difference to how the place is used?
A municipality can follow up the renewal of a square, a street or its lighting by counting the place before the works and again afterwards, using the same method at the same points. The visitor count, the flows and the time people stay then show whether the place is used more, used differently or used as before.
Will the data protection officer and the lawyers say yes?
A municipality that measures its own residents owes them more care than a shop does, so the measurement has to be privacy-compliant beyond doubt. The data protection officer and the legal team assess what the method produces, which is anonymous statistics on places and no personal data about anyone. Start with GDPR-compliant footfall analytics.
A DPO’s usual questions are listed in the DPIA guide, and the procurement guide shows how to write the requirement into a tender.
Councillors and the press want figures: what can the municipality show them?
The municipality can put the same figures in front of its committees, the press and residents: visitors per street and hour, the flows and the effect of an event, as anonymous statistics with exportable graphics. Dashboards are set up for each audience, and the People counting API feeds the municipality’s own reports.
Measure event impact covers how an event’s effect is set against a baseline.
Which other decisions do municipalities take on pedestrian counts?
- Does the district work as a 15-minute city?Counts and catchment per district show whether people really walk to what the map puts close by.
- Can the same counts go into the council report and a funding application?The per-street series that informs the planning can back both, with the metrics and formats listed under Data deliverables.
- Where do young people gather late, and what helps?Counts per place and hour, with dwell time, show where young crowds gather at odd hours, and in Västerås that led to adjusted security, benches, comfort features and skateboarding facilities.
- Should the market day move to another day?The weekly rhythm of each square shows when people are actually there, and the day can be picked to match.
- Does Wi-Fi counting in a town centre hold up legally?That depends on what the method collects and keeps, and the approval explained sets this out in writing. The method produces anonymous statistics and installs nothing on a phone.
- How do the station and the street connect?A measuring point at the station (Västerås has one at its central station) and counts along the streets from it show how the flow spreads, while transport hub analytics covers the station’s own footfall patterns.
- Which events should the municipality support next year?Compared on the same measures (how many came, from where, how long they stayed and whether the surrounding streets rose too), the events that drew a crowd for one evening stand apart from those that lifted the whole centre.
- How are the district centres and smaller towns doing, as well as the city?Counted the same way, each centre can be set against the others over time, and what a footfall benchmark is worth sets out when such a comparison can be trusted.
- Which footpaths and bus stops should be cleared and gritted first?Counts per route, hour and season show where most people walk early in the morning and through the winter, and the clearing order for footpaths and cycle routes can follow them.
What did the City of Västerås find?
In Västerås, Sweden’s fifth-largest city, years of measurement showed that the street taken for the main street was not the busiest. That finding changed shop windows, entrances, property values and rents. Read the City of Västerås case →
Curious what this looks like for your venue?

Approved and validated
Validated by academia, partners and customers, so a public body can rely on every number.
We have extensively evaluated Bumbee Labs' solution and the quality insights they produce, in combination with the efficiency of the remote installation process, make this a valuable collaboration. This alliance presents a great opportunity for our distribution ecosystem to provide a variety of service offerings to their customers, opening up new revenue streams.
Frequently asked questions
Is pedestrian counting suitable for a municipality?
Yes. Pedestrian counting with Bumbee Labs produces no personal data and is built to be anonymous, which is why municipalities and other public bodies use it.
Does pedestrian counting for a municipality require covering the whole city?
No. Covering the entry and exit points, the main corners and the hot spots is usually enough, and anonymous aliases tie a person's route between the measured zones together within a single visit.
Can pedestrian counting show a municipality which events lift the centre?
Yes. Counts on the streets around an event, read against the centre's usual level, show whether it filled one square for an evening or lifted the wider centre, by day and by night. The City of Västerås uses the data this way.
Where this fits
Part of
Industries and segments
Challenges
Metrics
Methods
Platform and integrations
Data protection:GDPR-compliant footfall analyticsThe IMY decisionDPIA for people counting