
Visitor analytics for museums & cultural venues
Understand your visitors and enhance every experience. Know when they come, how long they stay and what captures their attention.
Measured across galleries, halls and exhibits, privacy-first.
Trusted by









Why cultural venues choose Bumbee Labs
-
Grow attendance
See visitor numbers, peaks and repeat visits, and measure the impact of shows and campaigns.
-
Optimise the space
Find hot and cold zones across galleries and halls to place exhibits and ease flow.
-
Privacy-first
Anonymous measurement approved by a data protection authority, ideal for public institutions.
How it works
-
Measure
Wi-Fi across the venue's galleries and halls, supplemented with camera/sensor counting for precise counts at entrances and key rooms where Wi-Fi coverage is uneven.
-
Process
Anonymous data is processed in Bumbee Labs' statistical engine and calibrated against manual control counts.
-
Deliver
Dashboards on the Explore portal, plus exportable reports for boards and funders, and API access.
What data you get
Visitors are counted anonymously, total and per gallery, hall or exhibit.
- Visit counts and dwell time, total and per gallery, hall or exhibit
- Peaks, trends and repeat/return visits to plan staffing, opening hours and programming
- Hot and cold zones to place exhibits and ease congestion
- Paths and flows between spaces, the visitor journey through the venue
- Campaign and event impact, attendance lift from shows, outreach and advertising
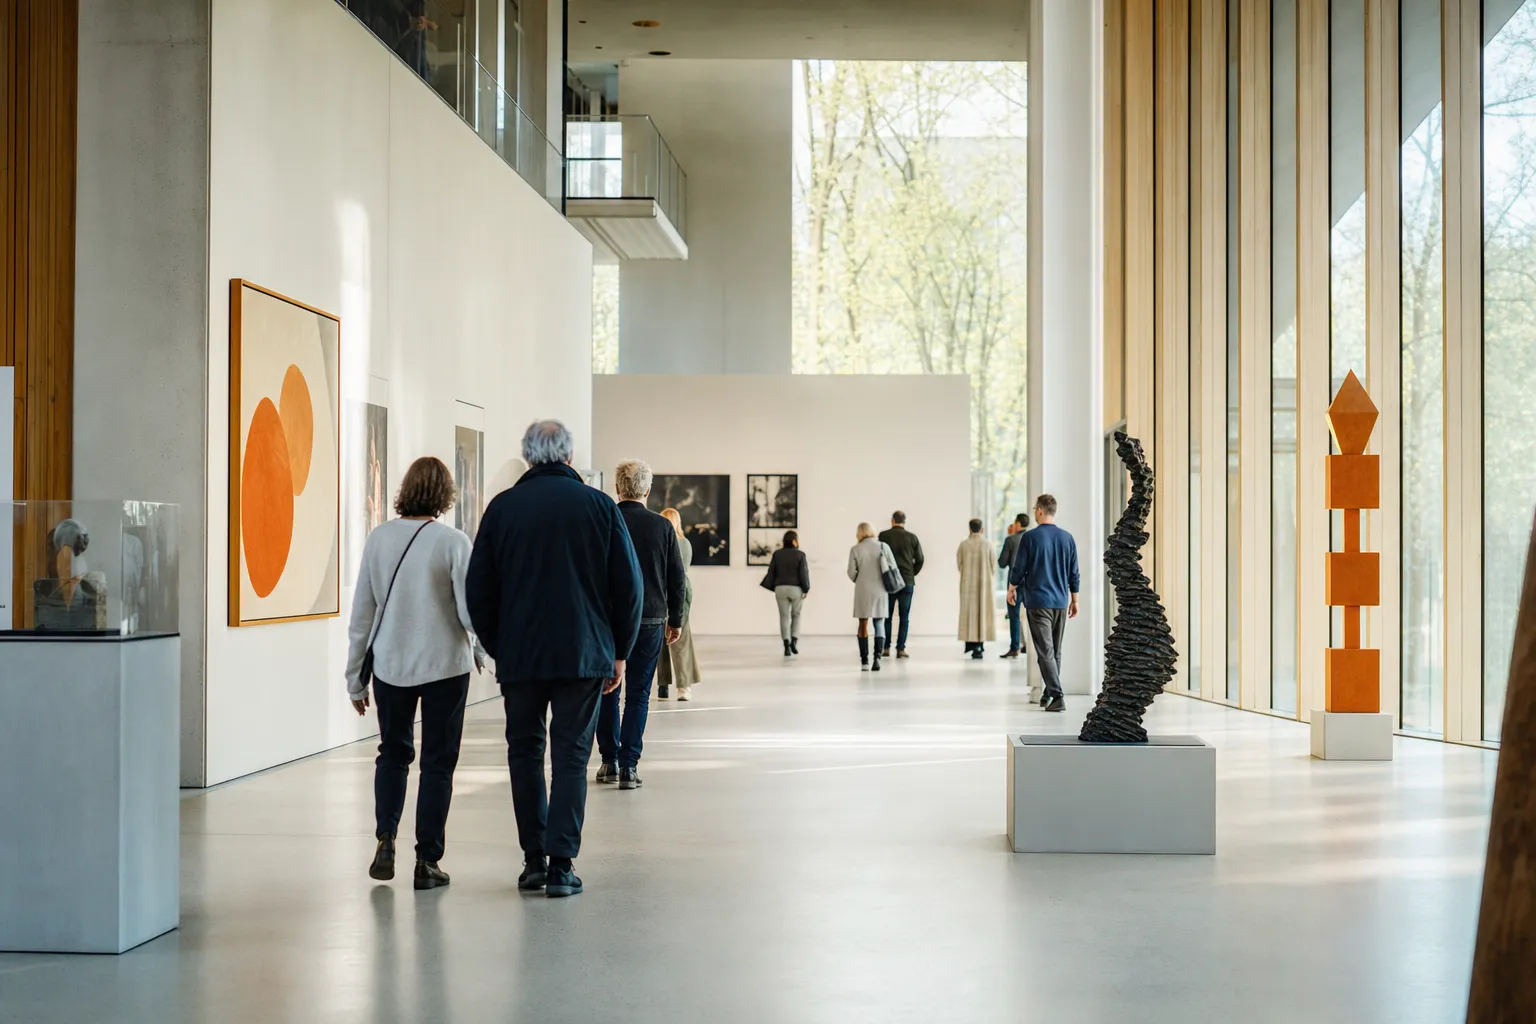
Attract visitors, keep them engaged, bring them back
Museums and cultural venues face a unique challenge: from permanent collections to temporary shows, success depends on knowing when visitors come, how long they stay and what holds their attention, and on proving that value to funders and partners. Privacy-first visitor analytics give cultural institutions the insight to grow museum attendance, improve operations and demonstrate impact. Visitors are counted anonymously throughout, with the only footfall method in Europe approved by a data protection authority; no one is ever identified.
What cultural venues use it for
- Increase visitor numbers and repeat attendance, and measure the impact of shows and campaigns.
- Optimise the mix and placement of exhibits and events.
- Improve advertising and outreach.
- Identify hot and cold zones, and enhance visitor flow, comfort and safety.
Dwell time does much of the work in these decisions, and dwell time explained covers how to read it gallery by gallery.
Visitor statistics for reporting to funders and boards
Cultural institutions need more than a headline attendance figure: they need visitor statistics by exhibition, by season and by programme type, in a format funders and grant bodies accept. Bumbee Labs delivers these as exportable dashboards and board-ready reports (real visitor numbers per gallery or hall, with campaign and event impact overlaid), so annual funder reporting is built on measured evidence rather than estimates. See what data you get
Museum visitor analytics: from counting to understanding
Museum visitor analytics is the discipline of turning anonymous visitor measurement — attendance, flows between galleries, dwell time per exhibit and repeat visits — into decisions a cultural venue can act on. Counting answers the first question: how many people came. Analytics answers the ones that follow: which rooms they moved through, where they lingered, what they walked past, and whether they came back. The distinction matters because the two serve different jobs. A headline attendance figure satisfies a funder’s reporting requirement; flow and dwell data tell a curator which galleries are pulling their weight and where the visit stalls. With zone-based measurement, both come from the same anonymous data: the total for the annual report, and the gallery-by-gallery detail behind programming, layout and staffing decisions. One measurement, both audiences.
How museums use Wi-Fi analytics to improve the visitor experience
Museums use Wi-Fi analytics to see, anonymously, how visitors actually use the building: the flows between galleries and halls, dwell time per exhibition, and where queues and crowding form. No one is identified and no images are captured; Wi-Fi-based people counting reads aggregate movement across the venue’s galleries and turns it into statistics about how each space performs.
That evidence supports very practical decisions. When flow data shows a wing that visitors reliably miss, signage and routing can be adjusted and the effect measured. When peaks and trends are visible across the day and the season, opening hours and staffing follow real demand rather than assumption. When a single popular work draws queues that back up into neighbouring galleries, its placement — or a flow intervention around it — can redistribute visitors before congestion suppresses the rest of the visit. And because dwell is measured per gallery, curators can see whether a re-hang or new interpretation actually changed how long people stay, gallery by gallery.
Choosing a museum analytics platform: what to look for
Museum analytics platforms differ widely in what they measure, and in what a publicly funded institution can put its name to. Six criteria separate a system you can defend from one you will have to explain:
- Anonymity with regulatory approval, not just a compliance claim. Many vendors say “GDPR-compliant”; approval by a data protection authority is a stronger assurance, and the one a publicly funded body can point to.
- Zone resolution down to gallery, hall and exhibit. An entrance total can’t compare exhibitions; zone-level counting shows visits and dwell per space.
- Funder-ready reporting. Exportable, board-ready reports built on measured, auditable numbers rather than estimates.
- API access, so attendance data can flow into the institution’s own reporting and planning tools instead of living in one more dashboard.
- A method mix, not a single sensor. Wi-Fi covers whole galleries and halls; camera or sensor counting adds precision at entrances and key rooms where coverage is uneven.
- Calibration against manual control counts. Figures reported to funders have to hold up to scrutiny, so the platform should validate its counts and say how.
People counters for museums — and what a counter alone can’t tell you
A people counter at the entrance answers one question: how many people came in. For a museum that has counted by hand, that is real progress — a continuous total instead of clickers and estimates. But an entrance total on its own can’t tell you which exhibitions earned their space, how long visitors stayed in each gallery, which rooms were walked past, or whether attendance is driven by new visitors or returning ones. Those are the questions that shape next season’s programme and the next funding round, and they need zone-level measurement — dwell, flows and repeat visits — rather than a single count at the door. The comparison people counter vs visitor analytics sets out when a simple counter is enough, and when analytics earns its keep.
Proof from a large public venue
The approach is proven at scale at Hovet Arena in Stockholm, where the same zone-based measurement handles intense break-time surges. In a museum the surge is a school visit or a blockbuster opening, and the KPI is engagement rather than concession sales, but the measurement underneath is identical: anonymous flows between zones, read in real time.
Curious what this looks like for your venue?

Compliant where it counts
The only footfall method in Europe approved by a data protection authority: anonymous, aggregated measurement a publicly funded institution can stand behind.
We are very happy to announce this partnership with Bumbee Labs to boost our Wireless solutions portfolio and bring what we believe is the future for retail businesses, measured by trustful data. What can't be measured, can't be improved.
Frequently asked questions
Can we see which exhibits hold attention?
Yes. Counting can be zoned to galleries, halls and individual exhibits, so you see visit counts and dwell time per space, and which exhibits people linger at versus pass.
Can it measure a single temporary exhibition?
Yes. Because counting is zoned, a temporary exhibition can be measured as its own space: visit counts and dwell time for the show itself, plus the attendance lift it created for the venue. That makes a temporary show directly comparable with the permanent collection, or with the same season last year.
Is this appropriate for a publicly funded institution?
Yes. Measurement is anonymous and aggregated, and the method's approval by a data protection authority makes it well suited to publicly funded bodies.
Can a limited, publicly funded budget justify this?
That is usually the point rather than the obstacle: automated counting replaces manual counts and estimates, produces the auditable visitor numbers funders already require, and the same data then serves layout, staffing and exhibition decisions. One measurement, several budget lines.
Can it work in galleries where Wi-Fi coverage is uneven?
Yes. Wi-Fi can be supplemented with camera/sensor counting for precise counts at entrances and in specific rooms.