Visitor Analytics for Public Transportation & Hubs
Smarter mobility, smoother passenger journeys
Transportation hubs—from subway stations and bus terminals to airports—are the beating heart of urban mobility. Managing them efficiently means balancing passenger flow, safety, and commercial opportunities. With Bumbee Labs’ GDPR-compliant visitor analytics, you gain the insights needed to optimize routes, reduce congestion, and maximize the value of your facilities.
Visitor Analytics for Public Transportation & Hubs
Goals for Public Transport & Hubs
Reduce transport planning costs
Optimize transport routes and schedules
Improve traveler and commuter experience
Reduce carbon footprint with smarter resource allocation
Identify hot & cold zones, bottlenecks, and anchor stations
Warum Bumbee Labs?
Accurate & scalable
>80% visitor sample, validated by customers and partners
Privacy-first
GDPR compliance confirmed in a European court of law
Cost-efficient
Leverages existing Wi-Fi and 4G/5G infrastructure—no heavy new investments
Trusted
10+ years of research, with proven success in public transport hubs worldwide
Wie es funktioniert
01
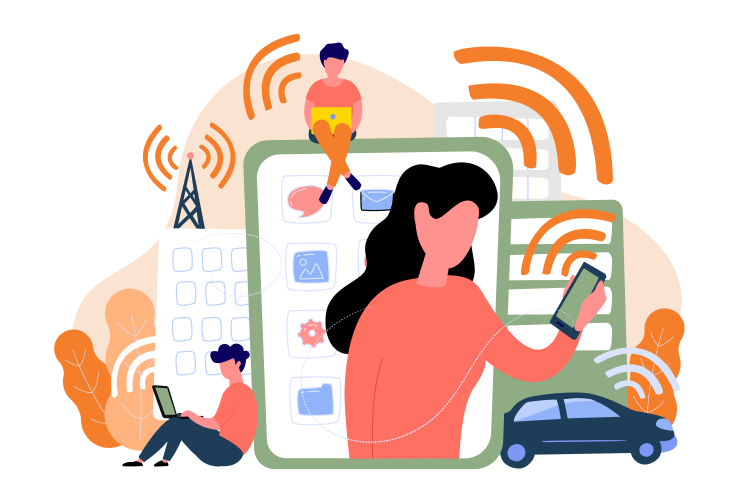
Passenger smartphones send out Wi-Fi probe signals.
02
Signals are collected through existing Wi-Fi networks or cellular data.
03
Data is anonymized, filtered, and processed in the Bumbee Labs cloud engine.
04
Results are visualized in Explorer-Dashboards or integrated into your transport management system.
Benefits for Transport Operators
Understand passenger flows
Measure commuter peaks and station dwell times
Identify entry/exit bottlenecks and optimize signage and layouts
Track flows between zones such as platforms, concourses, and retail areas
Improve operations & sustainability
Optimize timetables and routes with fact-based data
Allocate staff and resources where they’re needed most
Lower costs and carbon emissions through smarter planning
Maximize commercial potential
Measure exposure and impact of advertising and digital screens
Provide fact-based reach and impressions for media sales
Boost retail and F&B revenue by optimizing dwell times and placements
Was wir messen
Commuter Count & Travel Patterns
Zonendaten & Korrelation (Ströme zwischen Bereichen)
Höhepunkte und Tiefpunkte
Verweilzeit
Verankerungspunkte und Engpässe
Passers-By & Capture Rate
Beispielhafte Anwendungsfälle
Metro & train stations: Ease bottlenecks and improve signage placement.
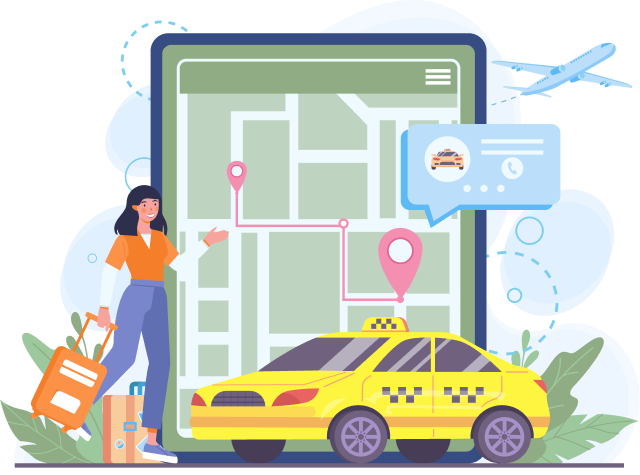
Flughäfen: Optimize passenger journeys “from curb to gate,” including check-in, security, and retail dwell times.
Bus & tram networks: Adjust timetables and resources based on true demand.
Transport hubs with retail: Track and increase footfall in shops and F&B venues inside the hub.
Ready to improve efficiency and passenger satisfaction? Kontaktieren Sie uns heute and learn how visitor analytics can transform your transport hub management.
Yes. By identifying crowding patterns and bottlenecks, you can adjust routes, schedules, and signage to improve passenger flow.
Q2: How is this different from ticketing data?
Ticketing shows sales, but not full passenger movement. Bumbee Labs measures actual flows, dwell times, and paths across the hub.
F3: Können Einzelhändler und Werbetreibende auf die Daten zugreifen?
Absolutely. Our analytics provide reach and impression data, enabling you to prove and increase the value of commercial spaces.
Eine Technologie, viele Anwendungen
Bumbee Labs hilft Ihnen dabei, zu verstehen und zu optimieren, wie Menschen sich bewegen, aufhalten und interagieren - ganz gleich, wie Ihre Umgebung aussieht, von Einzelhandelsgeschäften bis zu ganzen Städten.