Footfall Analytics for a Clean & Cost-Efficient Energy Future
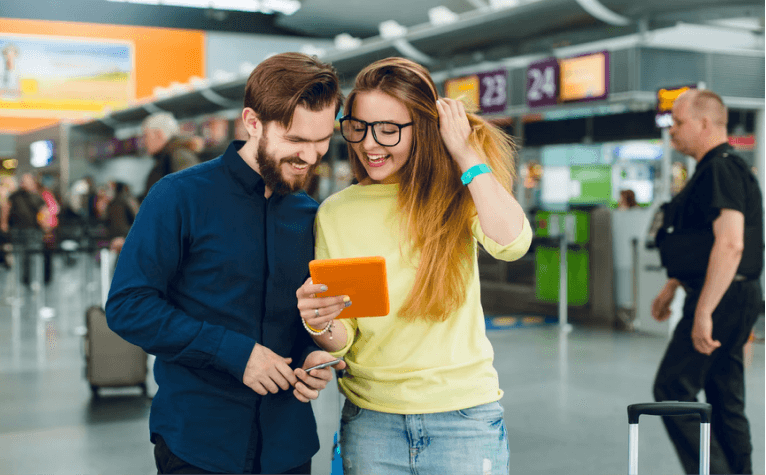
Smartere mobilitet, smidigere passagerrejser
Transportknudepunkter - fra metrostationer og busterminaler til lufthavne - er det bankende hjerte i byernes mobilitet. At styre dem effektivt betyder at afbalancere passagerflow, sikkerhed og kommercielle muligheder. Med Bumbee Labs’ GDPR-kompatible besøgsanalyser får du den indsigt, der er nødvendig for at optimere ruter, reducere overbelastning og maksimere værdien af dine faciliteter.
Mål for offentlig transport og knudepunkter
- Reducer omkostningerne til transportplanlægning
- Optimer transportruter og tidsplaner
- Forbedre de rejsendes og pendlernes oplevelse
- Reducer CO2-aftrykket med smartere ressourceallokering
- Identificer varme og kolde zoner, flaskehalse og ankerstationer

Hvorfor Bumbee Labs?
Præcis og skalerbar
>80% besøgsprøve, valideret af kunder og partnere
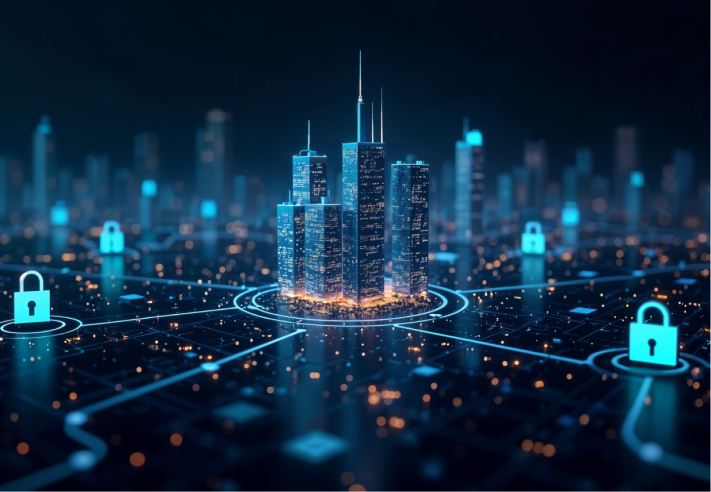
Privatlivets fred først
GDPR-overholdelse bekræftet af en europæisk domstol
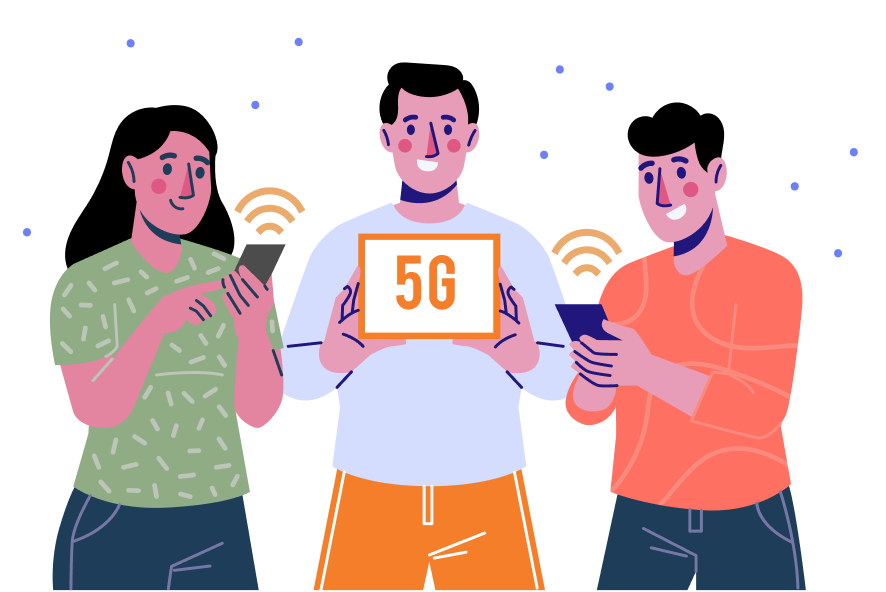
Omkostningseffektiv
Udnytter eksisterende Wi-Fi og 4G/5G-infrastruktur - ingen tunge nye investeringer
Betroet
Mere end 10 års forskning med dokumenteret succes i offentlige transportknudepunkter verden over
Sådan fungerer det
01
Passagerernes smartphones udsender Wi-Fi-sondesignaler.
02
Signalerne indsamles via eksisterende Wi-Fi-netværk eller mobildata.
03
Data anonymiseres, filtreres og behandles i Bumbee Labs' cloud-motor.
04
Resultaterne er visualiseret i Explorer-dashboards eller integreret i dit transportstyringssystem.


Fordele for transportvirksomheder
Forstå passagerstrømme
- Mål pendlernes spidsbelastninger og stationernes opholdstider
- Identificer flaskehalse ved ind- og udkørsler og optimer skiltning og layout
- Spor flows mellem zoner som perroner, haller og butiksområder
Forbedre drift og bæredygtighed
- Optimer køreplaner og ruter med faktabaserede data
- Tildel personale og ressourcer, hvor der er mest brug for dem
- Lavere omkostninger og CO2-udledning gennem smartere planlægning
Maksimer det kommercielle potentiale
- Mål eksponering og effekt af reklamer og digitale skærme
- Giv faktabaseret rækkevidde og indtryk til mediesalg
- Øg omsætningen i detailhandlen og F&B ved at optimere opholdstider og placeringer
Hvad vi måler
- Antal pendlere og rejsemønstre
- Zonedata og korrelation (flow mellem områder)
- Toppe og lavpunkter
- Opholdstid
- Forankringspunkter og flaskehalse
- Forbipasserende og indfangningsrate
Eksempler på brugsscenarier
- Metro- og togstationer: Fjern flaskehalse og forbedr placeringen af skilte.
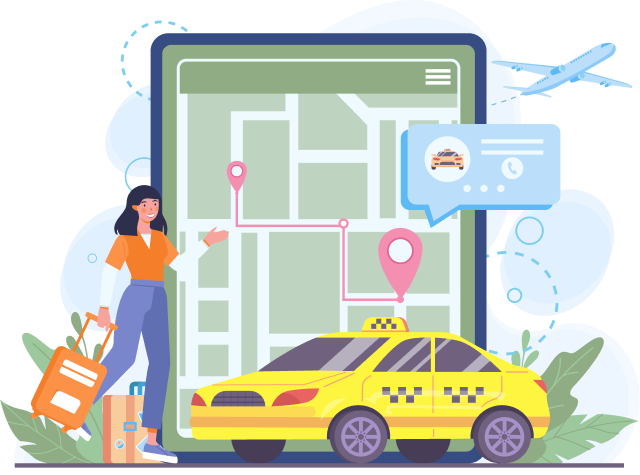
- Lufthavne: Optimer passagerernes rejse “fra kantsten til gate”, inklusive check-in, sikkerhed og opholdstid i butikker.
- Bus- og sporvognsnetværk: Juster tidsplaner og ressourcer baseret på den reelle efterspørgsel.
- Transportknudepunkter med detailhandel: Spor og øg antallet af besøgende i butikker og F&B-steder i centret.
Er du klar til at forbedre effektiviteten og passagerernes tilfredshed?
Kontakt os i dag og find ud af, hvordan besøgsanalyser kan ændre din administration af transportcentre.
Ofte stillede spørgsmål
Q1: Kan det hjælpe mod overbelastning?
Ja. Ved at identificere trængselsmønstre og flaskehalse kan du justere ruter, tidsplaner og skiltning for at forbedre passagerflowet.
Spørgsmål 2: Hvordan adskiller dette sig fra billetdata?
Billetter viser salg, men ikke den fulde passagerbevægelse. Bumbee Labs måler faktiske strømme, opholdstider og stier på tværs af knudepunktet.
Spørgsmål 3: Kan detailhandlere og annoncører få adgang til dataene?
Helt sikkert. Vores analyser giver data om rækkevidde og indtryk, så du kan bevise og øge værdien af kommercielle områder.
Én teknologi, mange anvendelsesmuligheder
Uanset dit miljø - fra detailbutikker til hele byer - hjælper Bumbee Labs dig med at forstå og optimere, hvordan folk bevæger sig, opholder sig og interagerer.